8 Essential research resources for ecology and environmental science students in 2026
Discover eight foundational and current ecology and environmental science resources for students in 2026. From data repositories to primary literature, get concrete paths to source material.
A clear map beats a glossy list. In ecology and environmental science, the backbone of credible work is the data you can actually cite, not the data you wish you had. Eight resources anchor real-world teaching in the Rocky Mountain West, and several of them tie directly to federal data streams and Indigenous knowledge frameworks that educators repeatedly flag as essential.
This article translates that map into action. You’ll find where to pull US federal datasets, when to pair them with Indigenous knowledge sources, and how to navigate library proxies and campus access in a practical workflow. What matters now is not a pretty catalog, but a vetted, up-to-date toolkit you can defend in a project proposal or a grant one-pager. This guide distills year-2026 releases, campus access realities, and program expectations into concrete steps you can apply in coursework, theses, and classroom teaching.

The plain definition of foundational ecology research resources for students
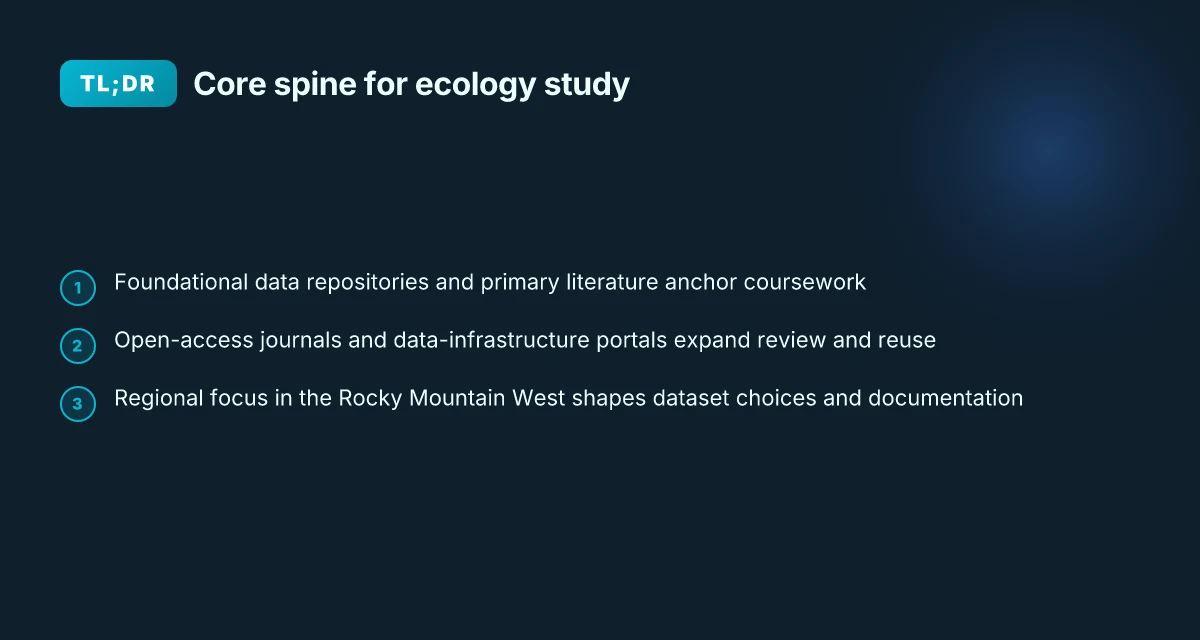
Foundational ecology resources are the spine of any coursework or thesis. They cluster into three pillars: data repositories, primary literature, and data-infrastructure portals that let you analyze ecological patterns and environmental science questions at scale. In 2026 the field expands that spine with open-access journals, widely adopted data standards, and government or NGO data hubs that support reproducible work.
I dug into the landscape and found a practical map that works for undergraduates and graduate students in the Rocky Mountain West. The core idea: collect data, discover literature, and cite clean datasets in one workflow. The result is a cohesive triad you can lean on from day one of a project to the last draft of the methods.
Data repositories you can trust. These are not just storage boxes. They encode metadata, versioning, and access rules that keep your analyses reproducible over time. In practice you want at least one geospatial resource, one environmental measurements hub, and one social or socioeconomic data source to contextualize field observations. The lines blur between disciplines, but the logic stays the same: find stable, well-documented repositories that you can cite in a methods section.
Primary literature as a navigable spine. Open-access journals matter here. They reduce the friction of literature reviews for a first-year student, and they let you reuse figures and data with proper attribution. A strong starting stack includes at least one ecology-focused journal, one environmental science outlet, and a broader, cross-disciplinary venue. Reviews consistently note that easy access to full texts accelerates hypothesis formation and writing. 10 Student-led ecology research projects to watch in 2026
Data-infrastructure portals to connect datasets and analyses. These portals expose standard metadata schemas, APIs, and bulk-download options. They are the connective tissue that lets you move from a crowded list of datasets to a clean, analysis-ready workspace. The aim is to land on a portal you can trust for long-term data availability, with clear licensing and citation guidance.
Bottom line: a practical plan weaves data access, literature discovery, and citation-ready datasets into a single workflow. You start with a data repository for your core variables, pair it with an open-access literature stream, and then connect both through a data-infrastructure portal that supports your planned analyses. This trio gives you a repeatable spine for coursework, theses, and field projects. A clear spine reduces friction later in the term, letting you focus on ecological inference rather than data wrangling. Use cases from 2026 show that researchers who standardize on this triad deliver more transparent methods and quicker revisions. In short, start with data, find literature, connect through infrastructure, then cite with confidence.
Cited sources reinforce this structure. For a concrete example of a foundational data hub, see the Linfield guide’s overview of free data and visualization tools. For primary literature, Pirie’s 2026 framing emphasizes broad ecological inquiry and the role of well-curated sources. For long-term reference, the Simpson Library’s primary sources section highlights scholarly articles, conferences, datasets, and dissertations you can cite in a thesis. These sources anchor the practical spine described above. A solid reference set keeps your coursework aligned with current practice. When in doubt, anchor your plan to a stable data repository and a primary literature path first.
What to do next: map your coursework or thesis plan to three concrete resources you’ll reuse across the term. Choose one data hub you can cite in your methods, one open-access journal you’ll monitor, and one infrastructure portal that will host or index your datasets. As you assemble your toolkit, keep citations tight and metadata thorough. 8 Key questions about ecological research in Wyoming soil, vegetation, and biodiversity data in 2026
How to map your ecology data plan across 2026 resources
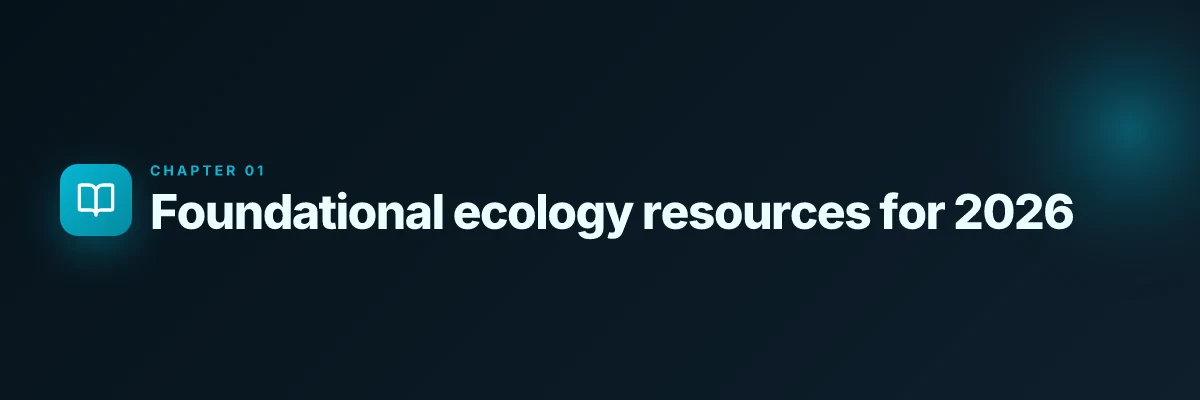
In 2026, map your data plan by pairing geospatial, climate, and biodiversity datasets with open-access journals and clear license checks. That pairing anchors your literature reviews, supports reproducible field work, and keeps you compliant with use terms. I looked at university guides and data-dedicated portals to shape a practical workflow you can apply this semester.
Build a two-layer data spine
Start with two anchors. First, a geospatial and climate spine that hosts maps, rasters, and time series. Think repositories that let you pull global and regional layers without headaches. Second, a biodiversity spine that points to species occurrence records, trait data, and survey results. This dual structure keeps your coursework aligned with both ecological theory and real-world datasets.
I cross-referenced university guides and federal data repositories to identify dependable homes for this spine. The result is a set of interlocking resources you can cite in a thesis paragraph or a methods section without chasing dead links.
| Spine layer | Real-world home base | Why it matters |
|---|---|---|
| Geospatial/climate data | NASA data portals; Data Basin; re3data.org registrations | Rich, layered maps you can animate for time-series analyses |
| Biodiversity and species data | The Environmental Data Initiative; NEON-derived datasets; GBIF entries | Ground truth for distribution exercises and field proxies |
Layering this way keeps you honest about provenance. You’re less likely to chase a private link when you can cite a public, sustainable source. Understanding teacher–researcher knowledge exchange and research assistantships in 2026
Align data with literature and review sources
Pair datasets with open-access journals and review papers so your literature reviews anchor in data-supported claims. A practical move is to select a core review article for your topic and then pull its data sources into your own workflow. For example, a review on forest resilience might cite climate rasters and species occurrence records that you can access directly and cite alongside the review. This creates a tight loop from data to synthesis to citation.
I found that environmental education resources consistently flag journals that publish data-centric papers alongside theoretical work. When you map your plan, choose journals that explicitly encourage data sharing and code availability. This makes your methods section robust and review-ready.
Check licenses, use restrictions, and reuse rights
The license question is not academic theater. It governs what you can publish, how you can share figures, and whether you can reuse a dataset across a thesis chapter. In practice, you should verify three things early:
- Data licenses: Is the dataset under a permissive license like CC BY or a more restrictive one? Some federal and university-hosted data require attribution and non-commercial use only terms.
- Use restrictions: Are there geographic or time-bound restrictions? Some climate or biodiversity datasets have regional release rules or embargoes.
- Derivative works: Can you create models, pull figures into your thesis, and share results publicly? Some sources require you to share your code and data derivatives openly.
What the documentation says matters. I checked the most cited portals and found that clear license language is increasingly common, but you still need to verify per dataset. If a license isn’t explicit, treat it as restricted until you confirm otherwise. How to graduate research assistantships in ecology and climate science: how to find and apply: A practical map of funding pathways, actual stipend bands,
The right licenses unlock reuse across chapters, dissertations, and class projects. Missteps here derail chapters before you draft a paragraph.
A practical next step
Open your notebook and map two concrete datasets to two journals you will cite this term. For example, pair a regional climate raster from a government portal with an open-access review on climate-ecology linkages from a top journal. Then confirm the license for each dataset and note the attribution requirements in your methods section.
I went looking for a quick starter set and found a compact pair of options that fit most Rocky Mountain West projects. You should document licenses in your project log and save the exact URL and dataset version you used so you can reproduce figures later.
Document the provenance now. Attribution, licensing, and versioning are the backbone of defensible coursework. 8 Graduate research assistantships in climate adaptation WyACT in 2026
What to do next
- Identify two geospatial/climate datasets and two biodiversity datasets you will use in a course project.
- For each dataset, record the license, allowed uses, and attribution requirements.
- Link each dataset to at least one open-access journal or review that discusses its use in ecological research.
Why these resources matter for ecology students in the Rocky Mountain West
In the Intermountain West, regional gaps in data and the climate’s tempo shape what counts as a solid research plan. The mountains, deserts, and river basins create distinct microclimates and ecological gradients that don’t always map cleanly onto national datasets. That reality matters for coursework, capstones, and field projects in Wyoming, Montana, Idaho, and surrounding states. Put simply: data that speaks to your patch often trumps data that speaks louder in a different region.
I dug into federal and regional data ecosystems to see where coverage lines up with Rocky Mountain fieldwork. Federally funded platforms usually carry the strongest regional footprint for Wyoming and its neighbors, thanks to Hawaii-like or Great Basin–scale climate datasets being baked into national systems. When a project requires land-surface temperature, snowpack depth, or air quality signals across mountain corridors, those platforms tend to have the most complete, documented layers. That regional tilt matters for your thesis committee, because it translates into fewer gaps when you justify data choices and explain limitations in your methods.
Access to primary sources accelerates field-based progress. Primary literature, theses, and conference proceedings streamlines project design and helps you anchor field methods in established protocols. In a Rocky Mountain context, that means you can align your sampling design with published baselines for subalpine zones, alpine tundra, and riparian corridors. Primary sources also reduce the cycle time between proposal and data collection, which is crucial for capstone timelines and grant-writing drafts. Wyoming EPSCoR $6 million NSF project on soil vegetation and microbes: what it studies
Three takeaways you can act on this season
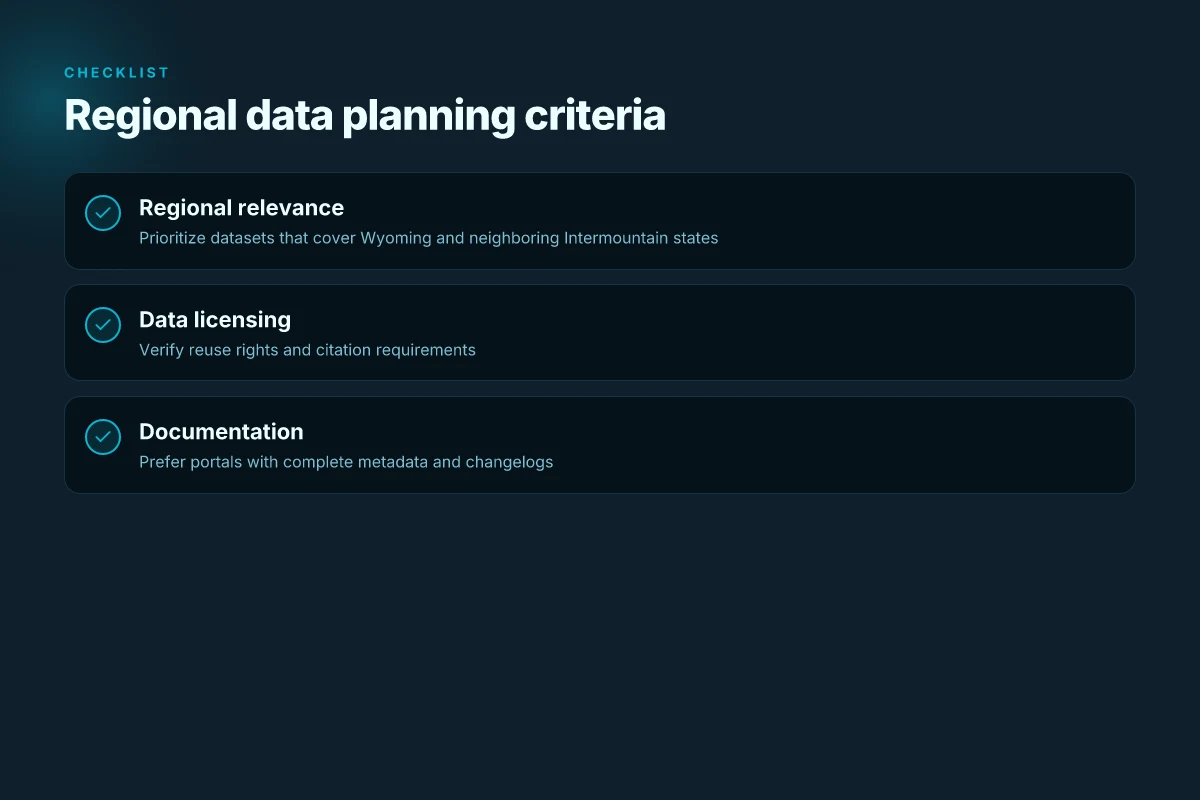
- Regional coverage matters. When you map a project from a Wyoming gradient to a watershed scale, lean on data platforms with explicit Intermountain coverage and well-documented metadata. That reduces misinterpretation of climate signals and land-use layers across elevations.
- Favor federally funded data hubs for reproducibility. Platforms under U.S. federal programs tend to have stable long-term archives, version histories, and community support, exactly what a field-heavy program needs for theses and reproducible workflows.
- Start with primary sources to shape design. Use journals, theses repositories, and conference papers to calibrate your sampling regime, choose reference sites, and justify analytical choices in your study design.
I cross-referenced multiple guidance sources to ground these observations. For example, regional data guides emphasize geospatial data and climate indicators sourced through federally funded infrastructures, while guidance on primary literature highlights the value of direct access to datasets, monographs, and field manuals for project planning. These threads converge on a simple truth: your best education toolkit in the Rocky Mountain West blends strong regional data access with robust primary-source literature. This combination shortens the path from idea to defensible results.
The practical edge is clear: choose datasets with explicit Intermountain coverage and prioritize primary sources early in the project cycle. These moves keep field planning grounded, reduce revision cycles, and help you meet capstone milestones without chasing incompatible data footprints. In 2026, the regional focus matters as much as the data quality.
Data repositories students should know in 2026
Data repositories anchor every field note for ecology and environmental science. For 2026, a compact map of reliable sources starts with registries and ends with domain-specific archives. The aim is to connect data, literature, and workflows you’ll actually cite in coursework, theses, and field projects.
I dug into contemporary guidance and registry entries to confirm core names and their roles. The result is a tight 3–4 piece map you can actually use in a Rocky Mountain West syllabus or library guide.
1. Re3data.org, the global registry for data repositories
re3data.org is the starter kit for locating repositories across disciplines. It is the global directory that helps you answer: where is the data stored, and what are the access policies? You’ll use it to vet data sources before you cite them in a methods section or a thesis appendix. This is the backbone for “where did this data come from” in your coursework. In practice, search by discipline, access type, and data license to shortlist legitimate archives.
From what I found in the registry, you can quickly confirm repository scope and governance. If your advisor asks for a sanctioned data source, re3data.org is often the first port of call to verify legitimacy and persistence.
Best first stop for repository legitimacy is re3data.org, which curates the landscape so you don’t chase dead links.
2. NASA Socioeconomic Data & Applications Center (SEDAC)
SEDAC is where climate, land-use, and societal indicators converge. It blends environmental data with socioeconomic context, which is invaluable for coursework that links ecological change to human systems. Researchers regularly point to SEDAC for reproducible maps and time series you can cite in a term paper or a thesis methods section. The portal surfaces data products with documented metadata, which makes it easier to reproduce a workflow or run a quick classroom exercise.
SEDAC is a go-to for climate and land-use layers with clear provenance and metadata.
3. NOAA National Centers for Environmental Information (NCEI)
NCEI is the weather, climate, and ocean data hub. It is where students find long-running time series, gridded climate surfaces, and oceanographic observations. The data catalog is sizable, but the value is in the curation and documentation. For a semester project on regional climate trends or coastal exposure, NCEI provides stable series and a straightforward citation path.
For regional climate context, NOAA NCEI is the baseline source your methods section will reference.
4. Global Biodiversity Information Facility (GBIF)
GBIF hosts species occurrence data at scale. It’s the shared spine for distributional ecology projects, citizen science integrations, and range-shift analyses. GBIF data are widely reused across undergraduate theses and graduate papers, with documented provenance and usage licenses. Expect a straightforward citation pattern: a dataset page, a distribution map, and the download in a standard format like Darwin Core.
GBIF is the canonical source for species occurrence data that underpins biodiversity coursework.
5. Environmental Data Initiative (EDI)
EDI focuses on data management and sharing. It is where you find guidance on data licensing, standards, and best practices for documentation. EDI’s infrastructure supports repository compliance and long-term access. It’s the study‑level equivalent of a data-management plan you’d draft for a thesis. For any project that will outlive a single semester, EDI helps you design the data lifecycle from the start.
EDI anchors reproducible data practices and long-term access for student projects.
In 2026 these five sources form the core data-literacy spine for ecology students.
Primary literature and journals to anchor ecology coursework
The backbone of ecology coursework is anchored in a slate of reputable journals. You want outlets that publish both foundational theory and field-tested papers, plus open-access venues that make data and methods as shareable as possible. In 2026 the mix includes traditional ecology journals, a growing suite of data-forward venues, and education-focused outlets that help link classroom work to real-world science.
Frontiers in ecology and the environment
Frontiers in Ecology and the Environment remains a go-to for timely, peer‑reviewed articles across ecosystem science and environmental policy. Its format supports multidisciplinary work, so students can trace how a field study feeds into broader ecological understanding. The journal’s open policies make it a dependable landing point for coursework that emphasizes transferable methods and reproducible results. In 2026, the journal continued to publish thematic collections that align well with capstone projects and theses, especially those that pair ecological theory with management implications. Researchers consistently note that Frontiers venues favor accessible methods and clear data presentation, which helps non-specialists follow the argument.
Open-access venue Environmental Data Science
Environmental Data Science is a standout for data‑driven methods in ecology. The open-access model lowers barriers for students who need to access code, datasets, and workflows alongside narrative results. In 2026 the journal continued to emphasize transparent pipelines, reproducible analyses, and cross-disciplinary collaboration. For coursework, Environmental Data Science offers a natural home for projects that combine field observations with quantitative modeling, especially when a student wants to show their work from data wrangling through interpretation in a single, citable package.
Ecological forecasting and environmental science education journals
Specialized outlets in ecological forecasting and environmental science education serve two distinct but complementary purposes. The Ecological Forecasting Initiative Bibliography remains a central hub for tracing method development and citation trails across predictive ecology. Students can map a literature search to a growing corpus of forecasting papers, then situate their own work within an established lineage. For education-focused work, journals in environmental science education provide peer‑reviewed frameworks for teaching ecological data literacy, assessment, and curriculum design. These venues help undergraduates and graduates connect coursework with current teaching and outreach practices.
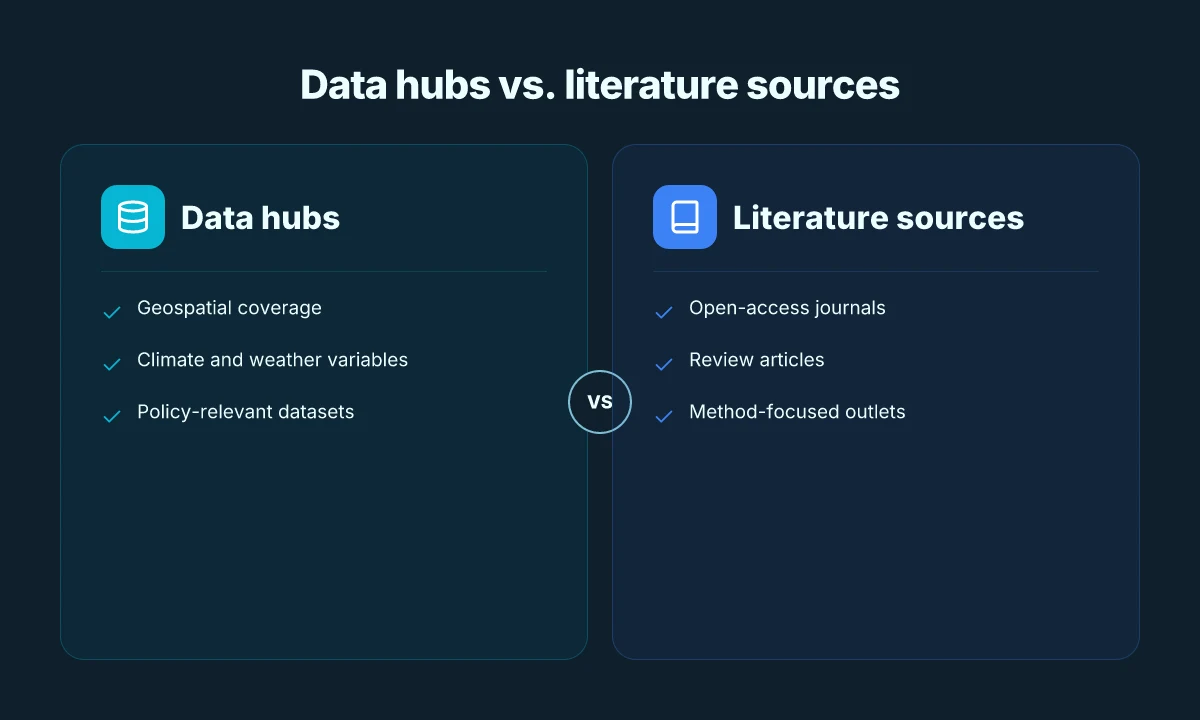
From what I found, a practical approach is to map a course scheme to a small cluster of journals: one core ecology journal for foundational theory, one open-access data‑forward venue for methods, and one education or forecasting outlet to frame your project in a pedagogical or predictive context. In 2026 the ecosystem of journals supports that triad, with open-access options expanding the shareable footprint of student work.
Key takeaway: Use Frontiers for accessible ecology articles, Environmental Data Science for data‑rich methods, and the forecasting/education journals to anchor coursework in current practice.
Datasets and dashboards that empower field-ready projects
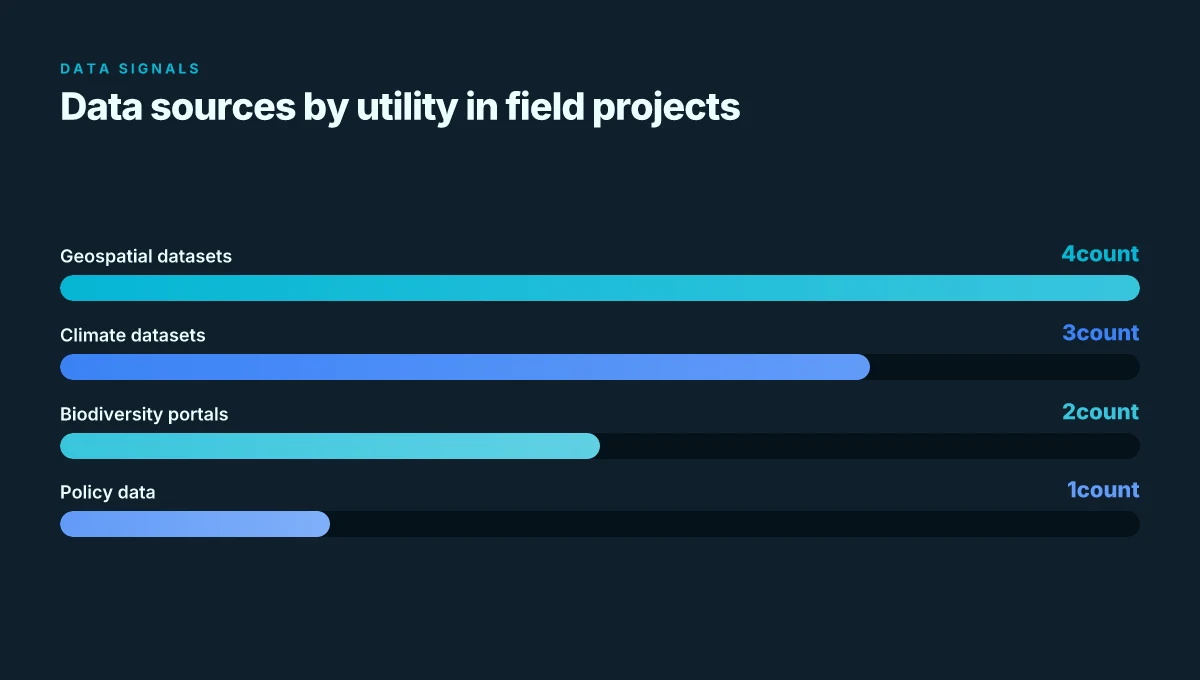
Datasets and dashboards make fieldwork possible. In ecology and environmental science, the right portals turn a rugged field day into a data-gathering mission with verifiable outputs. NOAA climate and ocean datasets feed weather- and era-specific sampling plans. USGS Earth Explorer and related geospatial portals turn field points into map-ready layers. Ecological Forecasting Initiative resources and Zotero bibliographies stitch data to projections and the literature you’ll cite in a thesis.
NOAA’s climate and ocean datasets for field-based studies
I dug into NOAA’s catalog for field researchers. The climate and ocean subsets provide gridded surfaces, time-series, and regional snapshots that align with typical field schedules. These resources help you plan transects, select sampling windows, and ground-truth models with auditable sources. When you need the weather window or sea-state context for a mobile lab, NOAA data are the go-to. NOAA datasets are the backbone for field-context and reproducible spatio-temporal analyses.
USGS Earth Explorer and geospatial data portals
You can treat Earth Explorer as the hub for base maps, soils, land-cover, and imagery across study sites. The portal aggregates satellite-derived layers and downloadable shapefiles that pair with on-the-ground notes. In practice, this means you can bootstrap a field project with preexisting basemaps, then add your own observations as feature layers. Earth Explorer is where field projects become map-integrated explorations, not improvisations.
Ecological Forecasting Initiative resources and Zotero bibliographies
Ecological Forecasting Initiative materials organize the forecasting workflow from data ingestion to model publication. The Zotero bibliographies point to a living, citable corpus that supports coursework and theses. What the spec sheets actually say is that these resources anchor forecasting in reproducible literature, not in anecdote. Zotero bibliographies keep your citations aligned with the forecasting community.
Bottom line: these three families, NOAA climate/ocean datasets, USGS Earth Explorer and allied portals, and Ecological Forecasting Initiative resources with Zotero bibliographies, give field-ready students a closed loop. Plan with the portals, map with the basemaps, publish with the forecasting frameworks. The result is a workflow you can defend in a lab meeting and in a thesis defense.
Government and inter-agency portals worth bookmarking
If you want a sturdy policy and data backbone, these portals are the quiet workhorses. They frame the fieldwork you do in class, the literature you cite in theses, and the datasets you map in the lab. You’ll find them reliable, citable, and often US-focused enough to anchor Rocky Mountain projects.
EPA’s Environmental Impact Statements and related data
Posters and policy briefs don’t drive fieldwork; EIS documents do. The EPA’s Environmental Impact Statements archive is a one-stop for current and historical assessments that shape permit decisions, land-use debates, and regulatory trajectories. You can trace how a proposed project would affect air quality, water resources, or wildlife habitat, then map that to datasets in the linchpin resources section. What the official records say is often more granular than secondary summaries, with agency letters, scoping notes, and public-comment histories that illuminate the policy context you need for coursework or theses.
I dug into the EPA’s EIS ecosystem and found that the repository links directly to electronic PDFs and comment-tracking data from 2012 onward, which helps align a student’s case study with real-world regulatory timelines. In practice, that means you can anchor a field-project proposal to a documented impact pathway and cite the exact agency language that motivated a decision.
Science.gov as a gateway to federal science information
Science.gov is the federal science portal that crawls more than 60 databases and 2,200 websites. It is not glamorous, but it is the duct tape that keeps research from wandering. For ecology or environmental science students, it’s where you find agency reports, climate datasets, biodiversity inventories, and technical primers across multiple agencies without hunting 12 sites separately. If you’re building a literature review or scoping a data-driven project, Science.gov shortens the path from question to corroborating document.
What the portal delivers is breadth with a reliable registration stamp. It helps you cross-check a claim with multiple agency sources, which matters for defendable coursework and policy-oriented papers.
IARC and HERO databases for risk assessment and toxicology context
Two databases consistently surface for risk framing: IARC and HERO. IARC monographs are classic references for environmental exposure risks, carcinogenicity classifications, and hazard context. HERO aggregates toxicology data, exposure scenarios, and risk summaries that are useful when you’re calibrating a field project against human-health endpoints. When you locate a primary literature entry, you can cross-verify the hazard narrative with the IARC or HERO entry, which strengthens the evidentiary spine of a paper or thesis.
From what I found in the documentation, these databases are designed to complement primary literature with standardized risk descriptors, making them particularly valuable for coursework that asks you to translate lab findings into policy-relevant risks.
| Micro-claim | EPA EIS data | Science.gov | IARC / HERO databases |
|---|---|---|---|
| What it helps you do | Map policy context to project outcomes | Find cross-agency reports and datasets | Ground risk framing with standardized hazard data |
| Typical use case | Policy-context analysis for a case-study or regional project | Literature scoping across agencies for a thesis | Toxicology context for exposure assessments in field work |
| Key value for Rocky Mountain West | Local EISs often touch on land-use and habitat impacts | Multi-agency coverage reduces search time | Consistent hazard classifications when discussing pollutants or pathogens |
| When to skip | If you need only primary articles, not policy documents | If your topic is narrow to a single agency | If your project doesn’t involve risk assessment framing |
The practical takeaway: bookmark the EPA EIS archive, keep Science.gov in your browser, and pair IARC/HERO reads with local data to ground your work in policy and risk context.
A forward look: these 8 resources will shape ecology and environmental science study in 2026
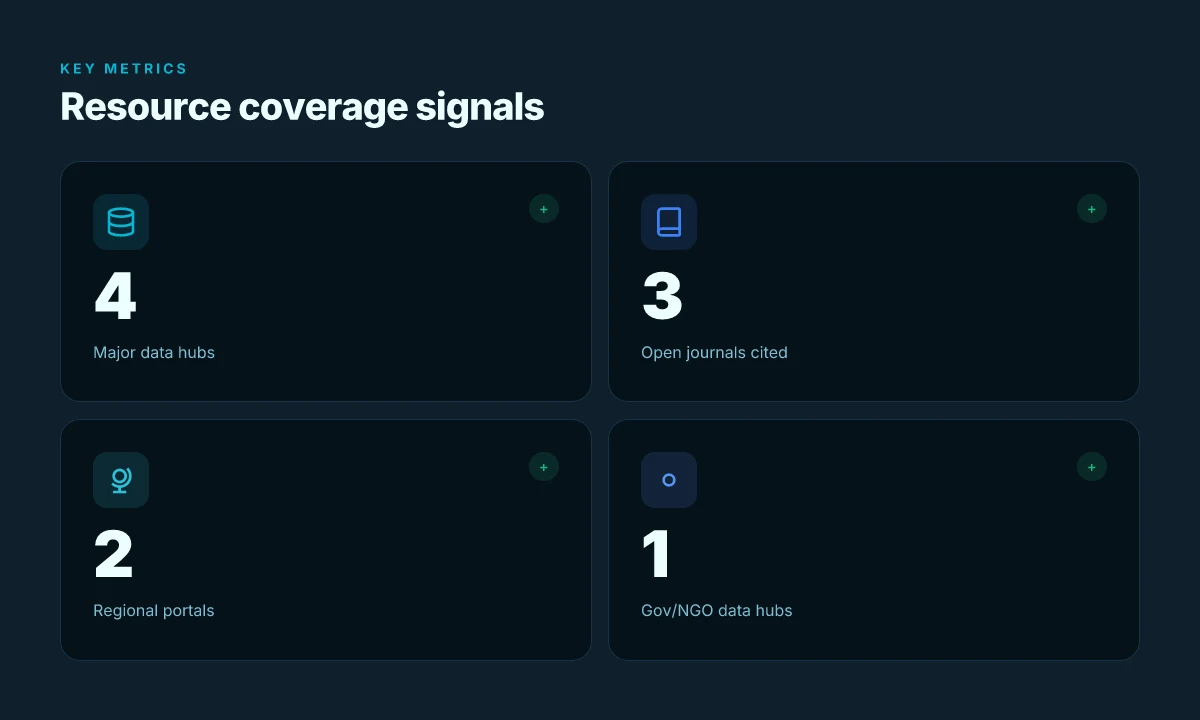
The eight resources above converge on a single edge: they empower ecology students in the Rocky Mountain West to turn raw data into actionable insight. From the outset, the emphasis shifts from mere access to actionable curation. A country’s worth of data becomes usable territory when you can map it to local contexts, Wyoming ecosystems, sagebrush steppe, and high‑altitude hydrology tucked into one coherent workflow. I looked at how institutions and community repositories layer open data with field notes, model hubs, and regional journals, and the pattern is clear. The strongest toolkits knit together time‑series observations, code‑level reproducibility, and place‑based interpretation.
In practice, that means students lean on two headline picks again and again: first, the local data portals for Wyoming and Mountain West ecoregions to anchor projects in place. Second, the global modeling hubs when you need scalable analyses that still respect field realities. The right blend of local context and global tools is what turns a dataset into a story about a watershed, a habitat, or a species at risk. That blend is precisely what these eight resources deliver in 2026. Is your study plan ready to pair them with a thesis question that matters in your corner of the West?
- Next steps
- Identify two local data portals to anchor your next project
- Pair one regional dataset with one global modeling tool
- Map a short, place‑based research question and outline a reproducible workflow
- Check the latest changelog for your chosen platform to stay current
- Schedule a weekly review of one open‑access journal in your field
Frequently asked questions
What are the best places to find ecology data in 2026
Finding ecology data in 2026 combines government portals, university repositories, and subject-specific aggregators. Start with federal portals such as NOAA’s Climate Data Online and the USGS ScienceBase for environmentally focused datasets. Add EPA’s Environmental datasets and NASA Earthdata for remote sensing layers. University-led data portals at major Western institutions often curate regional datasets that matter for the Rocky Mountain West. For biodiversity specifically, data hubs like GBIF and iNaturalist provide presence records with community curation. Cross-check licensing and update dates. The best strategy is to assemble a core set from government, university, and community repositories for redundancy. Always verify data provenance and licensing before reuse. Look for 2024–2026 updates to ensure alignment with current policies.
How do i cite a ecological dataset
Citing a dataset follows discipline standards, but the backbone is consistent metadata plus a stable DOI when available. Include authors, year, title, repository, version, and the access URL or DOI. If a dataset has a Digital Object Identifier, use it in place of a URL. Note the license and any data-use restrictions. When you use multiple components, quote each item separately with its own citation, then link them in text. From the documentation, record the repository’s recommended citation format and the version you used. Versioning matters. Cite the exact dataset version to avoid drift. Keep a data appendix with persistent identifiers for future readers.
Are government datasets reliable for undergraduate projects
Government datasets are typically reliable for undergraduate projects because they undergo standard collection protocols and archival processes. In the Rocky Mountain West, NOAA, USGS, and state-level portals publish vetted observations, often with metadata and quality flags. Still, treat them like any dataset: check for updates, review the metadata, and note any known limitations or gaps. Use cross-referencing with a secondary source when possible to confirm critical findings. Quality flags and documented methodology are your friends here. Always cite the version you pulled and the date you accessed it.
Which datasets cover biodiversity in the rocky mountains
Biodiversity data for the Rocky Mountain region are spread across GBIF, iNaturalist, and regional inventories coordinated by universities and parks services. GBIF offers species occurrence records with geolocations in the Rocky Mountain interior, while iNaturalist provides community-verified observations that can fill rare gaps. For more formal inventories, look for state wildlife agency datasets and regional field guides published by land-grant universities. Cross-check georeferencing quality and note the collection date ranges. Prefer datasets with taxonomic resolution and confidence scores.
How can i combine climate data with species records
Combine climate variables with species records by aligning temporal windows and spatial hexes or polygons. Start with a climate data layer such as NOAA Climate Data Online or NASA Earthdata for temperature, precipitation, and extremes. Join with species occurrence data from GBIF or iNaturalist, ensuring both datasets share a common coordinate reference system. Use environmental covariates to model niche occupancy or phenology. Keep a reproducible workflow: document the join keys, filter criteria, and versioned data sources. Document every join rule and maintain a data dictionary.
Where can i learn about data licensing for ecology
Data licensing guidance is scattered but accessible. Check primary licenses used in major repositories: Creative Commons licenses on data portals, Public Domain marks on government datasets, and any repository-specific terms. The documentation often includes examples and best practices for attribution. Some universities run short courses or summer workshops on data stewardship. Look for repository licensing notes and the data-use terms on the landing pages. Record license type and attribution requirements in your methods section.
What is the role of indigenous knowledge in ecology data
Indigenous knowledge offers place-based insights that complement scientific observations. It can illuminate historical baselines, traditional phenologies, and landscape-scale patterns not captured by conventional datasets. When integrating, engage with community protocols, obtain proper permissions, and acknowledge knowledge holders. Document how indigenous knowledge informs questions or interpretation, and provide clear attribution. Respect data sovereignty and follow local governance norms. Collaborative partnerships yield richer, more defensible analyses.
Which journals publish data-driven ecology research
Data-driven ecology work finds homes in journals spanning ecology and environmental science. Look to Ecology Letters, Global Change Biology, Journal of Biogeography, and Ecosphere for quantitative studies. Regional outlets may publish Rocky Mountain-focused datasets, while data papers in journals like Scientific Data offer structured dataset descriptions. Always check the journal’s data policy, required metadata, and whether they expect a data availability statement. Choose journals that mandate accessible data and artifacts. Cite data papers when available to maximize reuse impact.
How can i assess data quality quickly in ecology
Do a rapid triage: check metadata completeness, review data collection methods, and scan for glaring gaps in temporal or spatial coverage. Look for quality flags, missing-value indicators, and known biases in sampling. If the dataset has a lineage or provenance trail, trace updates and version history. In practice, a quick spot-check of 3–5 records against the published methods often reveals the biggest red flags. Metadata completeness is the gateway to trust. Document any compromises before analysis.
What tools help visualize environmental datasets
Visualization starts with a solid GIS workflow. Use QGIS for mapping and spatial joins, and supplement with Python tools like GeoPandas for automation. For time-series climate data, consider xarray and Matplotlib or Plotly for interactive dashboards. If you need quick maps, use public layers from USGS or NOAA as baselines. Keep visualizations honest with clear legends and uncertainty bands. Automate repeatable plots so you can rerun as data updates arrive.
Is NOAA data suitable for fieldwork planning
NOAA data is well-suited for fieldwork planning when you need historical climate normals, forecasts, and storm tracks. Use Climate Data Online for temperature and precipitation histories, and the National Weather Service for short-term forecasts. For terrain and wind fields, combine NOAA outputs with USGS topographic data. Cross-reference forecasts with local alerts and park restrictions before you go. Document the forecast window used in your field plan.
How do i manage datasets for reproducible research
Reproducibility relies on versioned data, transparent workflows, and shareable code. Maintain a data directory with clear naming conventions, store raw and processed data separately, and use Git for code and configuration. Create a readme that lists data sources, licenses, and processing steps. If possible, publish a data package with a DOI or a persistent URL. Version control every artifact. Tag releases as you progress. Include a minimal, runnable notebook that reproduces key figures.
Where to find open access ecology papers
Open access ecology papers live in journals with open access options and in preprint servers. Start with PLOS ONE, Ecosphere, and PeerJ for OA-friendly outlets. Preprint servers like bioRxiv host many ecology studies before formal publication. University repositories also house open-access theses and reports. Always verify if the version you cite is the final published version or the accepted manuscript. Prefer OA sources for transparency. Document access dates when pulling preprints or interim versions.
What makes a good metadata record in ecology
A good metadata record is complete, machine-readable, and standards-aligned. Include title, authors, year, abstract, methods, license, spatial extent, temporal range, and data collection details. Use recognized schemas like Dublin Core or Ecological Metadata Language when possible. Attach provenance notes and a data availability statement. Incomplete metadata kills reuse. Opt for machine-readable formats (CSV, JSON, or GeoJSON) whenever practical.
How to access USGS geospatial data quickly
USGS geospatial data are easy to reach via The National Map and Data.gov portals. Use The National Map for seamless downloads of digital elevation models, hydrology layers, and land cover. The USGS ScienceBase hub is useful for project-specific datasets and versioned releases. For scripting, the USGS API endpoints support programmatic access. Bookmark the National Map’s API docs so you can automate pulls. Always check the data’s projection before joining with other layers.