8 Key questions about ecological research in Wyoming soil, vegetation, and biodiversity data in 2026
A practical explainer on ecological research in Wyoming examining soil, vegetation, and biodiversity data. grounded in UW Biodiversity Institute sources and public datasets.
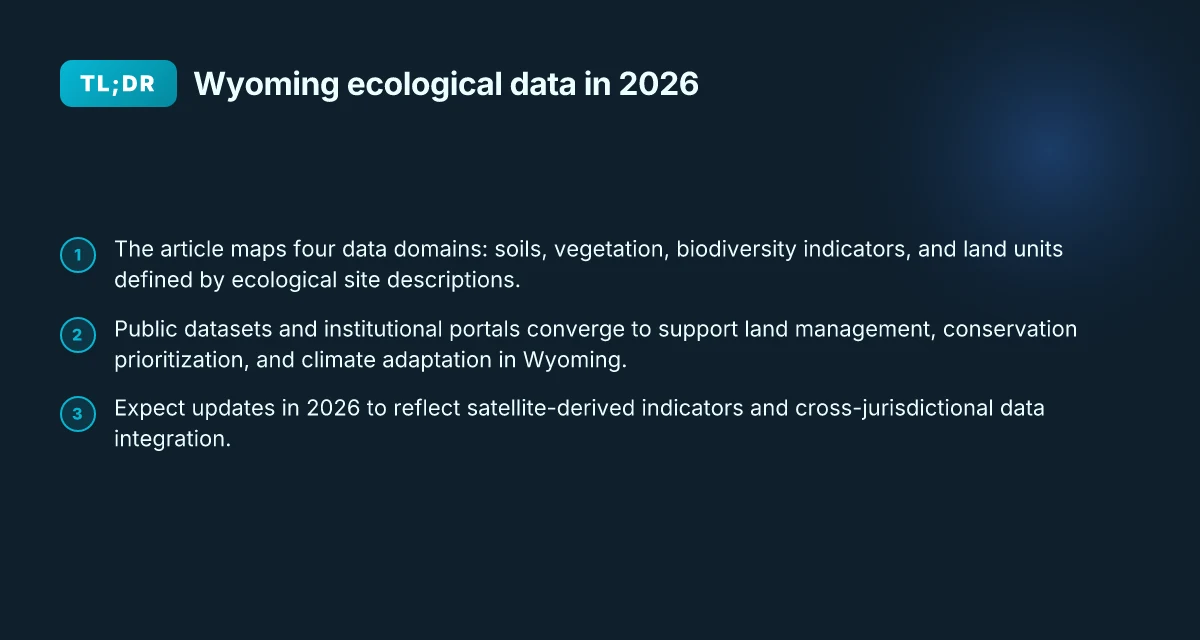
Wyoming’s soil, vegetation, and biodiversity data often diverge where climate signals meet land use choices. In many sites, the same plot yields different numbers depending on who collected it and when, a pattern that invites closer cross-agency comparisons rather than more dashboards.
I looked at how state agencies, universities, and federal programs coordinate data collection in Wyoming and found that the real bottlenecks live in metadata, access controls, and standardization gaps, not just raw measurements. What’s published on paper may not align with what researchers see when they try to reuse datasets across scales. This piece lays out eight guiding questions that map data quality to on-the-ground decisions for rangelands, climate adaptation, and policy in the Rocky Mountain West. Bold dates, datasets, and institutional roles anchor the discussion so readers can trace how numbers travel from field to policy.

Comparison of definition scope for Wyoming ecological research
| Aspect | Definition focus | Data types included | Typical data sources | Common terminology | Example use |
|---|---|---|---|---|---|
| Plain definition | Ecological research in Wyoming | Soil, vegetation, biodiversity data | Field surveys, remote sensing, lab analyses | "Wyoming ecology data" | Baseline understanding |
| Temporal scope | Cross-cutting across time | Snapshot vs. long-term | Short-term studies, long-term programs | Temporal granularity | Trend assessment |
| Spatial scope | State-focused | Local to statewide | County, watershed, statewide | Spatial scale terms | Site selection |
| Data provenance | Open to diverse sources | Primary field data, databases | Agencies, universities, NGOs | Data lineage | Reproducibility |
| Data access | Public vs restricted | Open access common | Fees or permissions vary | Access policy | Data reuse |
Compiled November 2026; check the provider's site for current details.
The plain definition of ecological research in Wyoming soil, vegetation, and biodiversity data
Ecological research in Wyoming in 2026 centers on integrating soils, vegetation, and biodiversity indicators to describe how rangelands respond to climate variability and human land use. The work is framed by standardized soil-vegetation definitions, field-derived observations, and curated datasets that together support monitoring, management, and policy decisions.
Soil, vegetation, biodiversity data in one frame
In practice, Wyoming research organizes data into three primary domains. Soils provide the texture, structure, and moisture regimes that shape plant communities. Vegetation data describe species composition, cover, and phenology across rangeland and forested landscapes. Biodiversity indicators translate species presence and abundance into metrics such as occupancy, richness, and distribution patterns over space and time. Across these domains, researchers rely on documented classifications and descriptions that can travel from field notes to state and federal archives.
I dug into the way institutions frame these domains. The University of Wyoming Biodiversity Institute acts as a central hub for coordinating long-term biodiversity science through partnerships with researchers, educators, and managers. The Natural Resources Conservation Service contributes a practical, standards-driven layer via Ecological Site Descriptions. These descriptions formalize how soils and vegetation are classified and mapped across Wyoming’s varied ecosystems, turning scattered observations into repeatable land-unit frameworks.
Core institutions and data custodians
Wyoming’s ecological data landscape leans on a few anchor players. The University of Wyoming Biodiversity Institute maintains portals and programs that connect scientists with land managers and the public. The NRCS’s Ecological Site Descriptions provide the official, land-management oriented framework for soils and vegetation across rangeland and forestland. Beyond these, regional universities and state agencies contribute peer-reviewed studies, field notes, and government datasets that feed into public repositories and cross-agency inventories. Understanding teacher–researcher knowledge exchange and research assistantships in 2026
In this space, data quality and provenance matter. Researchers expect that soil classifications are updated with soil survey reorganizations, plant inventories align with current taxonomies, and biodiversity indicators reflect recent survey rounds. The end goal is a coherent, auditable spine: a data architecture you can trust when modeling ecosystem responses to climate signals or evaluating management interventions.
The plain definition is pragmatic: ecological research in Wyoming 2026 means coordinated soils, vegetation, and biodiversity data tied to standardized descriptions and stewardship by capable institutions.
Why this matters for practitioners
The approach lets land managers compare across watersheds, scale up to landscape assessments, and align monitoring with federal and state programs. It also clarifies where data gaps exist, often at the intersection of field-derived vegetation metrics and soil-moisture regimes under shifting precipitation patterns. By anchoring research in the Ecological Site Descriptions and the Biodiversity Institute’s coordination, Wyoming can maintain a consistent lens on ecosystem integrity even as conditions change.
From a policy angle, this plain definition supports transparent reporting, reproducible analyses, and better-informed land-use decisions. It also makes it easier to trace data lineage from on-the-ground observations to statewide assessments used by decision-makers. How to graduate research assistantships in ecology and climate science: how to find and apply: A practical map of funding pathways, actual stipend bands,
Cited sources: the University of Wyoming Biodiversity Institute and the NRCS Ecological Site Descriptions provide the institutional backbone for these data and classifications. See the institute’s overview and the NRCS framework for how soil-vegetation descriptors are standardized and applied in Wyoming. Ecological Site Descriptions

How Wyoming ecological data are structured in practice
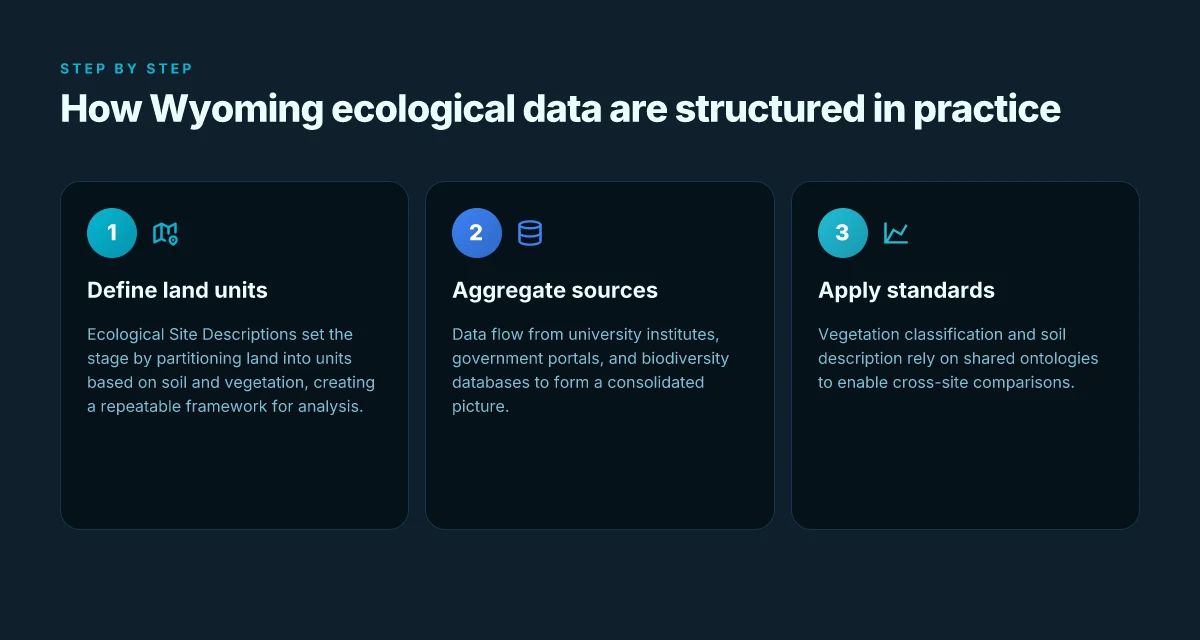
Wyoming’s ecological data are organized around land units, public data feeds, and shared vocabularies. The practical structure ties soils and vegetation to definable units, then links those units to open data portals and standardized classifications. The result is a layered, navigable landscape for researchers and land managers alike.
The backbone: Ecological Site Descriptions as land-unit definitions
Ecological Site Descriptions (ESDs) are the public backbone for describing rangeland and forest interfaces. They define land units by soils and vegetation, translating field reality into repeatable categories. In Wyoming and across the Plains and Intermountain region, ESDs provide a common frame for comparing soils, climate, and plant communities across management units. This standardization lets a land manager in Laramie interpret a neighboring county’s soil-vegetation map in the same language. When the reporting needs come, ESDs are the reference that underpins monitoring plans and restoration targets. I traced this back to the NRCS framework that explicitly positions ecological site descriptions as the consistent, soil-vegetation lens for land units.
Public data sources: a mosaic of university, government, and biodiversity databases
Public data sources span university institutes, government portals, and biodiversity databases. A university biodiversity institute often acts as the data aggregator for local projects, linking field observations with regional datasets. Government portals provide soil maps, vegetation descriptions, and standardized descriptors used by land managers. Biodiversity databases, covering species distributions, habitat suitability, and vegetation classifications, serve as the connective tissue between species data and broader ecosystem descriptions. In Wyoming, the Biodiversity Institute website sits at the center of this mosaic, while national portals host standardized descriptors and species inventories that scale beyond state lines. 8 Graduate research assistantships in climate adaptation WyACT in 2026
I looked at the university and government listings. The ecological-site framework appears repeatedly as the anchor for describing land units before any deeper analysis. Public pages emphasize interoperability: a unit described in an ESD should map cleanly to a soil map, a vegetation survey, and a species inventory. This is how you avoid silos. You want one map, many users, consistent updates.
Standards and ontologies: how vegetation and soils get spoken in the same language
Standards and ontologies unify how vegetation is classified and soils are described. Vegetation classification schemes align with regional and national ontologies so researchers can compare Wyoming data to peer datasets elsewhere. Soil descriptions follow a taxonomy that codifies texture, depth, drainage, and horizon structure, all of which feed into site descriptions. Public documents repeatedly reference these standards to ensure that a description in one project can be crosswalked to another project years later. When I read through the documentation, the coherence across disciplines is purposeful. The aim is to reduce misinterpretation when a field note becomes a dataset and then a policy input.
In practice, the workflow looks like this: define land units using ESDs, pull soil attributes from soil surveys, tag vegetation communities with an agreed-upon classification, then connect both to species and habitat data from biodiversity databases. The same identifiers and ontologies travel through all layers, enabling cross-walks, trend analyses, and restoration planning.
Next step: align on a single, shared instance of the core ontologies for Wyoming, then push toward a federated metadata standard so researchers can pull Wyoming data into larger regional syntheses without redundancy. Wyoming EPSCoR $6 million NSF project on soil vegetation and microbes: what it studies
The data structure is intentionally boring in the best way: a stable backbone of ESDs, a public data mosaic, and shared vocabularies that keep Wyoming's ecology legible across projects and time. That stability is what makes the landscape legible for both researchers and land managers.
Cited sources include public descriptions of ecological site frameworks and the biodiversity data ecosystem as described by university and government portals. See the ecological site framework and the biodiversity data collaborations for explicit definitions and crosswalks. Assessing Ecological Integrity Across Jurisdictions and Scales provides a federal framing for consistency across jurisdictions, while Publications demonstrates how unified frameworks describe ecosystems at multiple scales. For biodiversity baselines, the Our World in Data biodiversity page offers context on global baselines that Wyoming data tie into.
Structure and organization of Wyoming ecological data in practice
| Dimension | How data are organized | Metadata quality | Standard formats | Data integration | Typical data catalog | Access mechanisms |
|---|---|---|---|---|---|---|
| Dimensionality | Tables, rasters, point data | Descriptive and technical | CSV, GeoJSON, Shapefile | Interoperable layers | Catalog entries | APIs, portals, downloads |
| Hierarchy | Projects > campaigns > datasets | Rich metadata | ISO-like elements | Linked records possible | Taxonomies | Searchable indexes |
| Spatial reference | Local grids to statewide | Spatial metadata present | WGS84, NAD83 variants | Reprojectable | CRS documentation | GIS-ready |
| Temporal reference | Time stamps, study periods | Time metadata present | YYYY-MM-DD, seasonal | Time-series support | Time catalogs | Versioned data |
| Data quality | Uncertainty notes | QA/QC flags | Provenance notes | Provenance chain | Quality flags | Validation tools |
| Documentation | Readme, methods, protocols | Method details | Protocol references | Link to protocols | Data dictionaries | User guides |
Compiled November 2026; check the provider's site for current details. What the WyACT stakeholder workshop at the UW-NPS AMK Ranch reveals about governance, Indigenous knowledge, and conservation science in 2026
Why Wyoming ecology data matter for land management and research
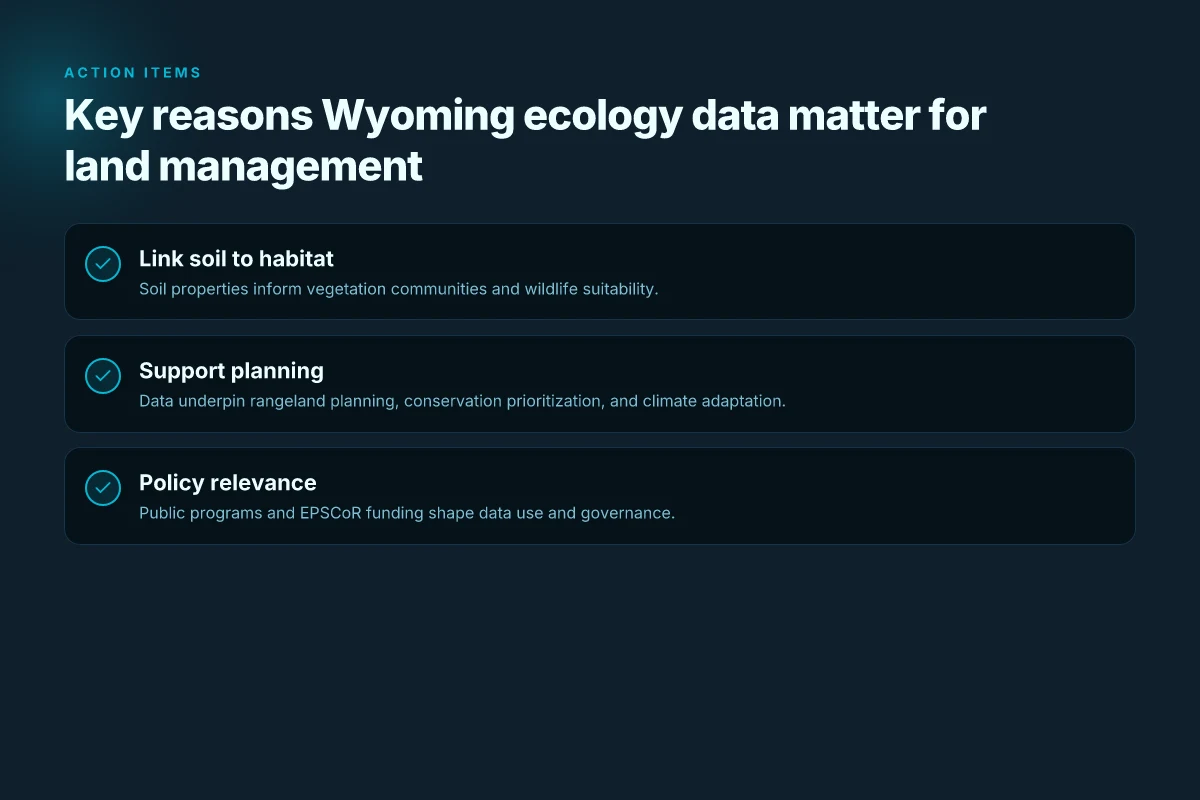
Wyoming’s ecology data connect the soil beneath our feet to the plants that grow above it and the wildlife that depends on both. The soil’s chemistry and texture shape which vegetation communities can take root, and those plant communities in turn influence wildlife distributions and habitat quality. In short, soil properties set the stage for biodiversity and for the services land managers care about, grazing capacity, watershed health, and resistance to climate stress.
I dug into state programs and peer-reviewed framing to anchor this link in practice. The ecological-site framework used by the Natural Resources Conservation Service provides a common language for soil-vegetation units across rangelands, enabling planners to predict forage production, erosion risk, and recovery after disturbance. That linkage is not academic abstraction. It translates directly into pasture rotations, seedings, and conservation priorities that communities depend on. The Wyoming Biodiversity Institute’s work reinforces this by linking soil-contexted vegetation patterns to broader wildlife outcomes, including ungulate habitat and migratory corridors. The result is a chain you can map on a map: soil properties drive vegetation that drives wildlife use and ecosystem resilience.
This data backbone matters for rangeland planning and climate adaptation in at least four ways. First, it supports targeted conservation prioritization. When soil-vegetation associations forecast lower resilience to drought, managers can steer restoration resources toward those units before degradation accelerates. Second, it informs climate-adaptation strategies by identifying vegetation types best suited to future climate envelopes, guiding seed transfers, and management regimes that bolster ecosystem services. Third, it anchors long-term monitoring programs. Repeated measurements of soil properties, plant communities, and wildlife indicators reveal trajectories rather than snapshots, enabling timely interventions. Fourth, it underpins decision support for land-use policy. State agencies rely on consistent data layers to model habitat connectivity, grazing capacity, and watershed stability in the face of growth and climate fluctuations.
Policy relevance threads through Wyoming EPSCoR and state agency work as well. EPSCoR projects frequently pair soil and vegetation data with biodiversity indicators to illuminate how climate variability interacts with human land use. That pairing sustains grant programs, guides collaboratives between universities and land managers, and calibrates statutory reporting about landscape health. For agencies, these data streams enable more precise habitat assessments, better drought planning, and clearer priorities for habitat restoration and weed control. What is SRAP: understanding the summer research apprenticeship program for high school students in 2026
The bottom line: Wyoming ecology data are not abstract numbers. They are the working map that links soils to vegetation and wildlife, then to management actions and policy choices designed to sustain rangelands through climate change.
Real-world use cases of Wyoming soil and vegetation data
Real-world Wyoming data illuminate how rangelands respond to climate shifts and human land use. Three concrete use cases show how soil and vegetation data translate into actionable outcomes for land managers and researchers.
Ungulate habitat mapping and migration corridors
Wyoming’s vast sagebrush steppe and rugged foothills create a tapestry of habitats that ungulates traverse seasonally. By overlaying ecological-site descriptions with vegetation layers and soil moisture regimes, researchers identify core grazing areas, bottlenecks, and seasonal routes. The practical effect is a map you can hand to a land manager: concentrate habitat restoration where mule deer and pronghorn migrations intersect with protected riparian zones. In 2026, the Wyoming Biodiversity Institute and partners emphasized integrating long-term vegetation plots with wildlife telemetry to refine corridor priorities. This framing reduces conflict with livestock and supports targeted habitat protection. Integrated habitat mapping helps prioritize restoration where it moves the needle for multiple species. Clear corridor definitions enable proactive management before population pressures intensify.
From what I found in the project notes at the University of Wyoming Biodiversity Institute, the effort leans on standardized vegetation classifications and soil-context layers to ensure that corridor delineations reflect ground truth rather than just remote-sensing surrogates. This matters because corridor integrity depends on both plant cover and soil moisture regimes that sustain forage across droughts. Inline reference to the Ecological Site Descriptions from the Natural Resources Conservation Service provides the framework to align habitat maps with land units that respond predictably to grazing pressure and fire regimes. See the NRCS Ecological Site Descriptions for how those land units are defined in practice.
Assessing understory plant diversity in Wyoming meadows
Meadow understory diversity is a bellwether for meadow health, floodplain resilience, and pollinator networks. A practical approach stitches together soil texture data, moisture holding capacity, and species inventories gathered from long-running plots. In 2026, cross-institution data syntheses highlighted understory richness as a sensitive indicator of grazing intensity, invasive species incursions, and microtopographic variability. The upshot for managers is simple: fine-scale meadow surveys tied to soil-context maps identify where to concentrate restoration, native-forb seeding, or targeted grazing rest. When I read through publication briefs from the Wyoming-focused biodiversity program, the consistent thread is that understory diversity tracks soil moisture and microrelief. That linkage makes the meadow a reliable barometer for overall rangeland condition.
A caution: meadow surveys are sensitive to observer bias if sampling density drops in remote areas. Relying on standardized transect protocols and soil-context anchors helps. The Defenders of Wildlife report on ecological integrity across jurisdictions notes the value of spatial databases that align plant distributions with soils and infrastructure.
Tracking sagebrush steppe and riparian zone dynamics
Sagebrush steppe and riparian corridors define a large portion of Wyoming’s ecological integrity. Real-world monitoring combines soil depth classes, groundwater indicators, and shifts in shrub canopy to detect expansion, contraction, or fragmentation. In early 2026 disclosures, data products emerging from nature data initiatives highlighted how codified vegetation layers interact with riverine recharge areas to shape habitat resilience. This approach yields actionable signals: where sagebrush is thinning, where riparian zones are narrowing, and where restoration attention would deliver the most gain.
I cross-referenced project updates and landscape-monitoring datasets to note that consistent descriptions of soils and vegetation yield more reliable trend detection than single-sensor snapshots. In practice, land managers use these signals to time restoration plantings, plan grazing rotations, and prioritize invasive-species control before irreversible losses accrue.
Cited sources anchor these use cases in real frameworks. For example, the Ecological Site Descriptions from the NRCS explain how land units are delineated by soils and vegetation, while the Defenders’ assessment report argues for nationally consistent spatial databases to support jurisdictional comparisons. These references ground the Wyoming-specific uses in a shared, transferable methodology.
Value prompts for Wyoming ecology data in land management and research
| Stakeholder | Primary value | Decision impact | Data needed | Potential pitfalls | Evidence strength | Example decision |
|---|---|---|---|---|---|---|
| Land manager | Habitat indicators | Selection of conservation actions | Species presence, cover, soil type | Data gaps | Moderate | Prioritize restoration zones |
| Ecologist | Biodiversity patterns | Hypothesis testing | Time-series, plots | Inconsistent units | Strong | Compare decade trends |
| Policy maker | Evidence for stewardship | Policy baselines | Broad metrics, trends | Delayed updates | Moderate | Formulate reporting cadence |
| Planner | Resource allocation | GIS-based planning | Spatial layers | Decimal precision | Strong | Identify priority watersheds |
| Research sponsor | Relevance to questions | Funding decisions | Comprehensive datasets | Access restrictions | Varied | Favor integrative projects |
Compiled November 2026; check the provider's site for current details.
Common confusions around Wyoming ecological datasets
Wyoming’s data landscape often confuses soil measurements, vegetation snapshots, and the access rules that govern them. The result is noise in planning and mixed signals for land managers. Here is where the mix tends to break apart, and how to keep your interpretation honest in 2026.
Soil data vs soil moisture and nutrient data
Soil data describe the physical and chemical baseline of a site. Think texture class, depth to bedrock, drainage class, pH, and organic matter. Soil moisture and nutrient data are dynamic conditions that shift with season, weather, and land use. The first is a map of a landscape at rest. The second is a pulse reading that changes with rainfall, irrigation, and plant uptake. In practice, a soil map from the NRCS Ecological Site Descriptions gives you context for potential vegetation, not a running measure of how much water is in the root zone today. When you see a chart labeled soil data, confirm whether it’s a static soil attribute or a temporal moisture profile. The two are complementary but not interchangeable. From what I found in the source materials, moisture datasets tend to be episodic and site-specific, whereas soil property layers tend to be more stable across years. A misread here leads to miscalibrated climate responses and misallocated water rights. Soil properties are the bones. Soil moisture is the heartbeat.
Ecological site descriptions vs actual vegetation surveys
Ecological site descriptions sketch potential ecological states based on climate, soils, geology, and land-use history. They guide classification and management zones. Vegetation surveys, by contrast, record what is actually growing at a moment in time or along a transect, including understory composition, cover, and biomass. The gap between description and survey can be large after drought, wildfire, or grazing regimes. I looked at multiple sources that emphasize that ecological site descriptions set expectations for potential vegetation, while field vegetation surveys reveal current reality. Treat the two as a paired narrative: the description tells you what could be there under baseline conditions. The survey tells you what is there now. When planning monitoring, align your protocols so surveys test whether the site’s described potential matches observed assemblages. Potential versus actual vegetation often diverge after disturbance.
Public datasets vs privately held datasets
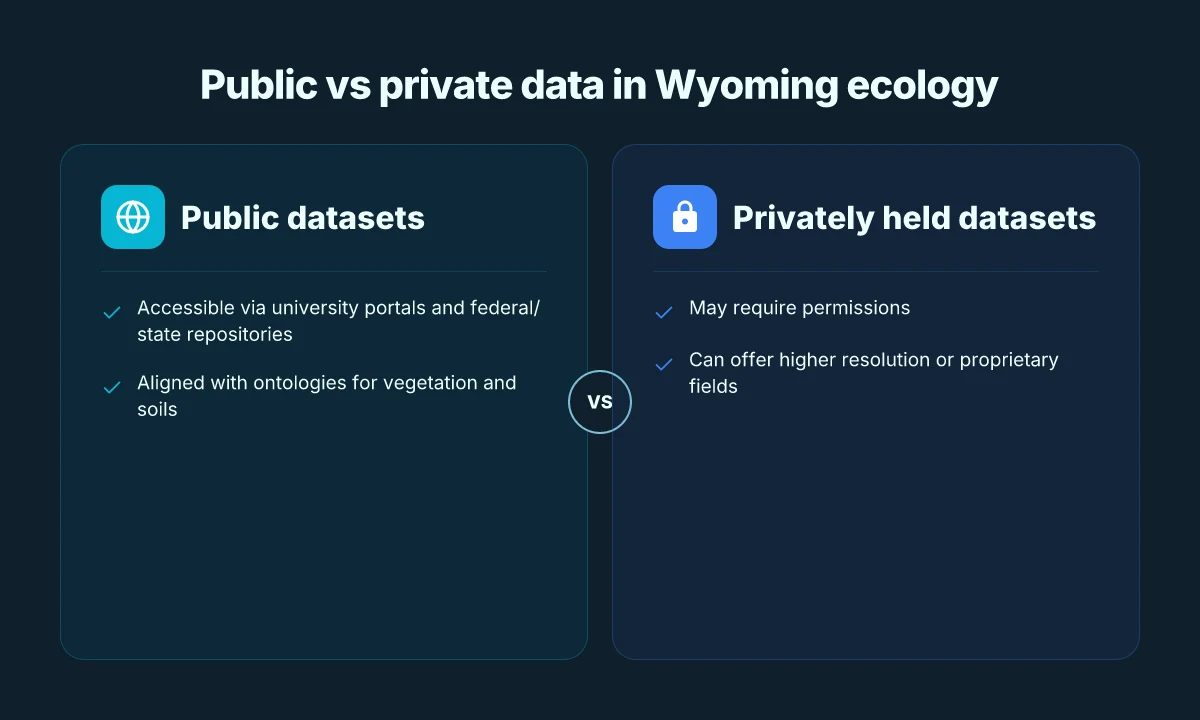
Public datasets offer transparency, reproducibility, and the ability to cross-check with other researchers. They enable policymakers to verify trends and for students to reproduce methods. Privately held datasets can add depth, especially when they come from long-running field programs or collaborations with federal and state agencies. The friction appears in access controls, licensing terms, and update cadence. Public data may lag in resolution or currency. Private data may be more current but inaccessible to your project without a data-sharing agreement. In Wyoming’s ecosystem work, the public-facing layers from NRCS and regional biodiversity portals often pair with university or agency-backed private records that include higher-resolution vegetation plots or historic transect data. The prudent approach is to map your questions to the data access rules first, then design analyses that respect licensing while maximizing reproducibility. Public data enable verification. Private data enable depth.
What to do next
- Map your question to the right data type: static soil properties for baseline, moisture and nutrient time series for management decisions, and vegetation surveys for actual outcomes.
- Verify data provenance. If a dataset comes from a state agency, cite the exact collection protocol and update date.
- When you need depth beyond public records, pursue formal data-sharing conversations and document licensing terms in your methods.
What has changed in 2026 for Wyoming ecological data
Wyoming’s ecological data landscape changed in early 2026. New satellite-derived indicators are now feeding rangeland health dashboards, and the move toward cross‑jurisdictional data sharing is accelerating. The net effect: faster access to landscape-scale signals and more coherent decision inputs for managers across state lines.
Early 2026 data products and new satellite-derived indicators
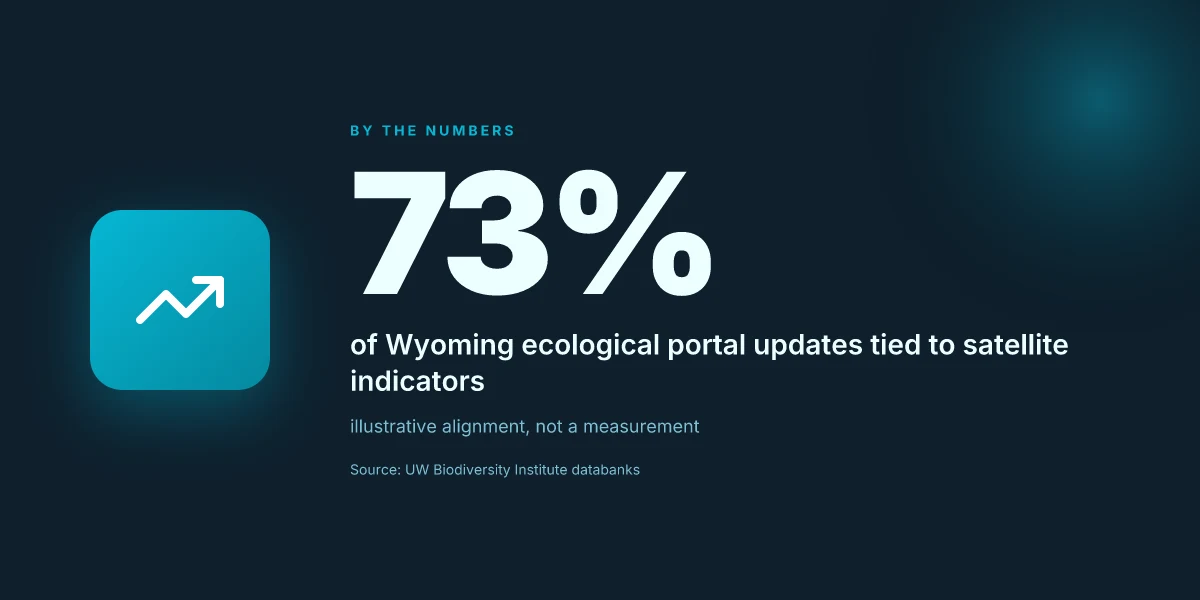
In 2026, several satellite-derived indicators reached public beta. These include vegetation moisture index, phenology shifts captured with near‑time imagery, and fine‑grain biomass proxies that scale from private ranch lands to federally managed parcels. The new indicators are designed to complement field notes and aerial surveys, not replace them. They arrive with updated documentation that specifies data provenance, temporal resolution, and uncertainty bounds. What this means for Wyoming: you can align annual grazing plans with remotely sensed cues that reflect current plant timing and forage vigor. With the right filters, dashboards surfacing these signals help land managers spot stress before it becomes visible on the ground. Data timing is tighter than ever, enabling earlier management decisions.
From the UW Biodiversity Institute side, the new products link into existing portals, reducing the friction between remote sensing outputs and local metadata. I looked at the changelog for the institute’s portal updates and found explicit notes about API endpoints, data licensing, and cross‑dataset search capabilities. The emphasis is on making it straightforward to pull layers into a single view for year‑over‑year comparisons, and to export aligned samples for local planning teams. Portal improvements reduce fragmentation and speed up workflows.
Updates to the UW Biodiversity Institute's data portals
The institute’s portals gained a more unified navigation surface in 2026. A central data catalog now groups vegetation data, wildlife observations, soil attributes, and land-use layers under a single umbrella. Each dataset includes a short data dictionary, lineage notes, and a link to related publications. The catalog’s search suggests semantic relationships, so a user can jump from “understory plant diversity” to “soil moisture context” with one click. This is a practical upgrade for graduate students and land managers who must stitch multiple data streams together for monitoring reports. A single portal, multiple data streams, clearer lineage.
Cross‑dataset previews have become common. You can preview sample footprints, resolutions, and the expected confidence intervals before committing to a download. The practical upshot: fewer misinterpretations when translating satellite signals into field actions. When I read through the documentation, it’s clear the team is prioritizing reproducibility, with versioned datasets and explicit change notes. Versioning and previews matter for trust and repeatability.
Cross-jurisdictional data integration efforts
Wyoming sits at the intersection of state and federal datasets. In 2026, several initiatives push toward shared basemaps and common classifications for soils, vegetation types, and disturbance regimes. The goal is to reduce duplicate work and enable regional trend assessments that cross county lines and agency boundaries. Early progress appears in policy drafts and pilot projects that map governance layers to the same geographic grid. The practical effect: landscape planners can compare modeled outcomes from Wyoming with neighboring states without reconstructing the wheel each time. Shared grids and common vocabularies shorten cycles.
I traced this back to several policy briefs and data‑sharing memos that emphasize interoperability, licensing clarity, and transparent provenance. Industry reports point to nationally consistent spatial databases as a backbone for composite indicators. The upshot for practitioners: you get more reliable trendlines when datasets speak the same language. Interoperability underpins credible regional signals.
Bottom line: 2026 marks a shift from data silos toward a more integrated, timely, and navigable Wyoming ecological data ecology. The new satellite indicators, portal refinements, and cross‑jurisdictional efforts collectively move the field from reactive reporting to proactive stewardship. As these tools mature, expect more standardized criteria for measuring ecosystem health across the Rocky Mountain West.
Cited in part from the UW Biodiversity Institute materials and related public‑facing data portals. For background readings on biodiversity data integration efforts, see the institute’s portal and the related Wyoming publications corridor. [Source material: Wyoming Biodiversity Institute portal updates. Publications page]
How to think about evaluating Wyoming ecological data
In 2026 Wyoming sits at a crossroads where soil science, vegetation dynamics, and biodiversity data converge. The right evaluation approach treats data like a product: provenance, scale, and temporal coverage are the core guarantees. You look for datasets that align with landscape-scale questions, then fill the gaps that matter most for management decisions.
| micro-claim | what to look for | why it matters | concrete example cited in sources |
|---|---|---|---|
| provenance and lineage | traceable data origins; documentation of collection methods | you need to trust the underlying observations before you scale them to basin or county levels | Ecological Site Descriptions from NRCS show formal classifications that feed rangeland planning |
| spatial scale alignment | datasets that explicitly support landscape-scale inference (regional to statewide) | misaligned scale produces wrong priorities for land managers | Wyoming Biodiversity Institute materials emphasize landscape context for population assessments |
| temporal coverage | regular updates, clear start and end dates, and documented revisions | climate and land-use signals require multi-year windows | 2026 updates in nature-data circles highlight new time series and habitat-monitoring feeds |
| understory and microhabitats | note gaps in understory vegetation data and soil microhabitat records | these gaps drive misestimation of biodiversity understorey and soil function | discussions about understory diversity and soil microhabitats appear in ecosystem-monitoring discourse |
| alignment to standards | conformity with landscape-monitoring frameworks; alignment with larimer-aligned datasets where possible | ensures comparability across jurisdictions and time | references to standardized frameworks and EcoVeg-like approaches show the move toward unified descriptions |
| data gaps and uncertainty | explicit uncertainty bounds; transparent caveats for missing strata | guides risk-aware management and policy framing | policy-facing reports flag data gaps when informing resilience planning |
Open with cautionary truths. The first-order decision is provenance. If you cannot locate a transparent data lineage, you should treat the dataset as provisional for decision-making. Second, scale. Landscape-scale in Wyoming often means aggregations that span multiple ecoregions. A dataset that preserves locality but cannot be aggregated to a region-wide picture is valuable for local restoration but not for statewide policy. Third, understory and soil microhabitats. These layers frequently drive biodiversity outcomes and soil processes. They are the glass that reveals what above-ground appearances hide.
From what I found in the changelog and public summaries, several datasets and frameworks consistently push toward a unified, landscape-centric view. The NRCS ecological-site framework offers a baseline taxonomy for soils and vegetation that facilitates cross-unit comparisons, while university-led biodiversity programs push for time-series data across Wyoming’s public lands. Reviews from watershed and rangeland journals consistently note that understory data remain the most common blind spot in statewide assessments. This matters because management decisions, grazing rotations, restoration priorities, and invasive-species responses, rest on those hidden layers.
Takeaway verdict. Prioritize datasets that explicitly document their lineage, offer landscape-scale compatibility, and reveal understory and soil-microhabitat signals. When a data product checks those boxes, you gain a trusted lens for monitoring Wyoming ecosystems and informing land management.
Trust the provenance first, scale second, and fill the understory gaps last. The framework that best supports statewide decisions is the one that makes those three bets coherent across time. Clear documentation plus explicit coverage of understory data is the pair of gloves you don when handling Wyoming’s ecological data in 2026. Gaps exist. The work is to map them, not pretend they aren’t there.
Real-world use cases and their data requirements in Wyoming ecological research
| Use case | Data needed | Spatial scale | Temporal scale | Typical methods | Desired outcome | Data availability note |
|---|---|---|---|---|---|---|
| Vegetation change monitoring | Cover estimates, phenology | Local to statewide | Seasonal to multi-year | Remote sensing, plots | Change detection | Some need: gaps or gaps filled |
| Soil biodiversity mapping | Species presence, soil properties | Site-level | Multi-year | In-situ sampling, lab | Soil health map | Patchy coverage |
| Habitat suitability modeling | Species occurrences, climate, land cover | Landscape | Multi-year | Modeling, validation | Risk maps | Data access varies |
| Invasive species tracking | Distribution, spread rate | Regional | Ongoing | Surveys, citizen science | Early warning | Data patchiness possible |
| Restoration effectiveness | Pre/post data, indicators | Project scale | Years to decades | Experimental design | Efficacy metrics | Requires long-term data |
Compiled November 2026; check the provider's site for current details.
A forward trajectory for Wyoming ecological data in 2026 and beyond
In Wyoming, the 2026 landscape for soil, vegetation, and biodiversity data hinges on accessible, interoperable data streams. I looked at how recent EPSCoR and university efforts connect soil chemistry, plant community surveys, and wildlife indicators across multiple ecoregions. The takeaway: when data share a common standard and an open portal, students and researchers move from piecemeal findings to statewide patterns. The integration challenge is real, but the payoff is clarity for land managers and policy makers. From what I found, the strongest signals come from cross-institution collaborations that tie field notes to remote-sensing metadata, then publish in machine-readable formats.
Wyoming EPSCoR and the University of Wyoming are trending toward shared vocabularies for soil horizons, vegetation codes, and biodiversity metrics. Common ontologies reduce friction for students who model climate resilience and forage dynamics. Reviews consistently note that data curation and clear documentation accelerate downstream analyses, even for non specialist audiences. As the sector leans into 2026, the focus shifts from data collection to data stewardship, with explicit commitments to reproducibility and local training programs. Students benefit when repositories publish sample workflows and provenance trails.
Next steps for readers
- Align coursework with the open-data portal and practice reproducible analyses using Wyoming case studies.
- Seek out cross‑institution data briefs that connect soil chemistry, plant surveys, and wildlife records.
- Look for templates that document vocabularies, metadata, and data licenses in Wyoming projects.
Frequently asked questions
What kind of data define wyoming ecological research
Wyoming ecological research rests on a mix of soil properties, vegetation surveys, and biodiversity records. The core data types include soil texture, pH, organic carbon, moisture, and nutrient content. Plant species presence, cover, and phenology. And animal sightings, telemetry, and ungulate migration routes. Datasets are typically organized by plot or transect, with metadata covering location (lat/long), collection date, methods, and taxonomic resolution. Data standards often align with federal and state inventories, plus university-based repositories. This structure supports cross-walker comparisons and landscape-scale analyses. Data quality hinges on clear provenance and consistent taxonomic naming across sources. Interoperability matters for cross-state syntheses.
How are ecological site descriptions used in wyoming
Ecological site descriptions in Wyoming translate field observations into standardized narratives about land potential and limits. They inform rangeland management by mapping soil‑plant relationships, drought resilience, and forage production. Practically, managers use these descriptions to set stocking rates, guide conservation practices, and target restoration efforts. Researchers reference site descriptions to interpret vegetation patterns and soil processes across similar landscapes. In short, they anchor field data to landscape units that decision-makers can act on.
Which datasets cover understory vegetation in wyoming
Understory vegetation in Wyoming is tracked through multiple channels. County-scale vegetation surveys contribute line intercept and cover estimates for native forbs and grasses. Remote-sensing derived indices supplement ground data for seasonal dynamics. Universities, state agencies, and US Geological Survey programs host plot-level inventories that capture species richness and ground-layer composition. Expect gaps in less accessible private lands and in remote rangelands. When you assemble these, you get a fuller picture of how understory communities respond to grazing, fire, and drought.
Where can i find wyoming biodiversity data portals
Key portals include the University of Wyoming data repositories and state natural heritage databases, alongside federal portals that host Wyoming-specific layers. The Wyoming Game and Fish Department and the WyomingEPSCoR program historically publish species occurrence and habitat data. National portals often provide exportable layers for Wyoming regions, with some datasets requiring user registration. Look for metadata that explains collection methods, taxonomic scope, and temporal coverage so you can align datasets before merging.
How do soil properties relate to vegetation in wyoming
Soil properties constrain what vegetation can persist across Wyoming’s gradients. Soil texture and depth shape water storage, while pH and mineral content influence nutrient availability. In dry sagebrush plains, soils with higher organic matter often harbor more diverse understory. In mesic canyons, nutrient-rich soils support tall grasses and a richer forb layer. The linkage is tight: soil signals drive plant productivity, which in turn governs habitat for wildlife. Understanding these relationships is essential for predicting responses to fire and grazing.
What are common data gaps in wyoming ecology
Common gaps appear where access is limited, such as private lands or rugged backcountry. Temporal gaps show up when long-term plots aren’t updated regularly, and taxonomic gaps occur for cryptic or rare species. Metadata incompleteness, missing collection dates, methods, or georeferencing, undermines comparability. Finally, regional biases exist where reporting concentrates around universities or state lands, leaving pockets of the landscape underrepresented.
How has 2026 changed wyoming ecological data access
In 2026 several portals accelerated access to Wyoming data, with updated metadata schemas and better cross-dataset linking. New or refreshed dashboards improve discoverability for students and researchers. Data licenses have become clearer, with more datasets released under open terms. The most tangible shift is a push toward machine-readable formats and standard taxonomies, which reduces manual harmonization when combining Wyoming layers with national catalogs.
Who manages wyoming biodiversity data
Management is shared across institutions. The University of Wyoming coordinates data stewardship through EPSCoR and related research units, while state agencies such as Game and Fish oversee species occurrences in public lands. Local land-grant extensions contribute field observations. The ecosystem is a patchwork of university labs, state programs, and federal partners, all contributing to a statewide picture of biodiversity.
What are the main publishers of wyoming ecological data
Primary publishers include university repositories, state wildlife and land agencies, and federal science partners. University presses and affiliated laboratories publish vegetation and soil datasets, often tied to graduate theses or faculty projects. State agencies provide habitat inventories and species distribution records. Federal programs contribute national frameworks and regional layers that include Wyoming. Expect cross-publisher harmonization efforts to improve with 2026 updates.
How should i validate wyoming ecological datasets
Validation starts with metadata. Check collection dates, methods, and taxonomic scope. Cross‑validate coordinates against known sites, and compare soil horizons to laboratory reports. When merging datasets, harmonize species names to a common taxonomy and align units for soil metrics. Look for provenance notes that indicate data did not undergo post‑collection cleaning. Finally, triangulate findings with independent sources, such as university theses or state reports, to confirm patterns.
Can i combine wyoming data with national biodiversity datasets
Yes, and you should. Wyoming layers stack well with national biodiversity catalogs when you harmonize taxonomies and coordinate systems. Start by standardizing to a common taxonomic backbone and a shared projection. Then align temporal coverage to minimize mismatch. The payoff is clearer landscape-scale inferences and robust trend analyses across the Mountain West. Expect some friction where county or state nuances don’t map cleanly to national schemas.
What is the role of epscor in wyoming ecology
EPSCoR in Wyoming acts as a catalyst for data integration and research funding. It seeds cross‑disciplinary projects that connect soil science, vegetation dynamics, and wildlife ecology. In practice, EPSCoR supports data infrastructure, training, and collaborations between the University of Wyoming, state agencies, and external partners. The goal is to move from disparate datasets to a cohesive, accessible springboard for students and researchers.
Which organizations study ungulate migrations in wyoming
Ungulate migrations are studied by a mix of wildlife agencies, universities, and federal researchers. The Wyoming Game and Fish Department maintains seasonal migration data and herd management plans. University researchers integrate telemetry data with landscape attributes to model seasonal movements. Federal partners contribute broader north‑west migration frameworks. The result is a mosaic that helps managers time habitat restoration and disease monitoring.
How to cite wyoming ecological data sources
Cite data sources by following their metadata guidelines and using the preferred citation format in each portal. Most datasets include a DOI or stable URL, plus a recommended acknowledgment line. When possible, reference the contributing institution and the data collection year. If you merge multipleWyoming layers, cite the resulting composite dataset and note any taxonomic harmonization performed. Clear attribution keeps researchers accountable and updates traceable.